Sea Level Measurement
Seeking Rate and Finding(?) Acceleration

Sea level measurement, or the measurement of the rate of sea level rise, remains one of the most contentious issues regarding climate change. Interestingly, it is not fundamentally an issue of anthropogenic climate change, but rather of natural variation following the trough of the Little Ice Age. Its association with anthropogenic climate change is limited to the alleged recent acceleration in the rate of rise.
Sea level measurement is complicated by the fact that the surface being measured is constantly in motion. Sea level is measured in two basic ways: tide gauges mounted on fixed points at the water’s edge and altimeters flown on satellites. The measurements remain contentious because the satellite measurements indicate a rate of sea level rise approximately 1.5 – 2 times the rate measured by the tide gauges.
Tide gauge measurements have a long historical record, in some cases more than 150 years. The measuring instruments are located immediately adjacent to the water level and are readily accessible for calibration checks. However, tide gauge measurements are complicated by changes in the position of the surface to which the gauge is mounted resulting from settling due to soil instability, subsidence due to subsurface fluid extraction, and rebound rise from compression in prior ice ages. There is also a great difference in tidal effects at many tide gauge locations.
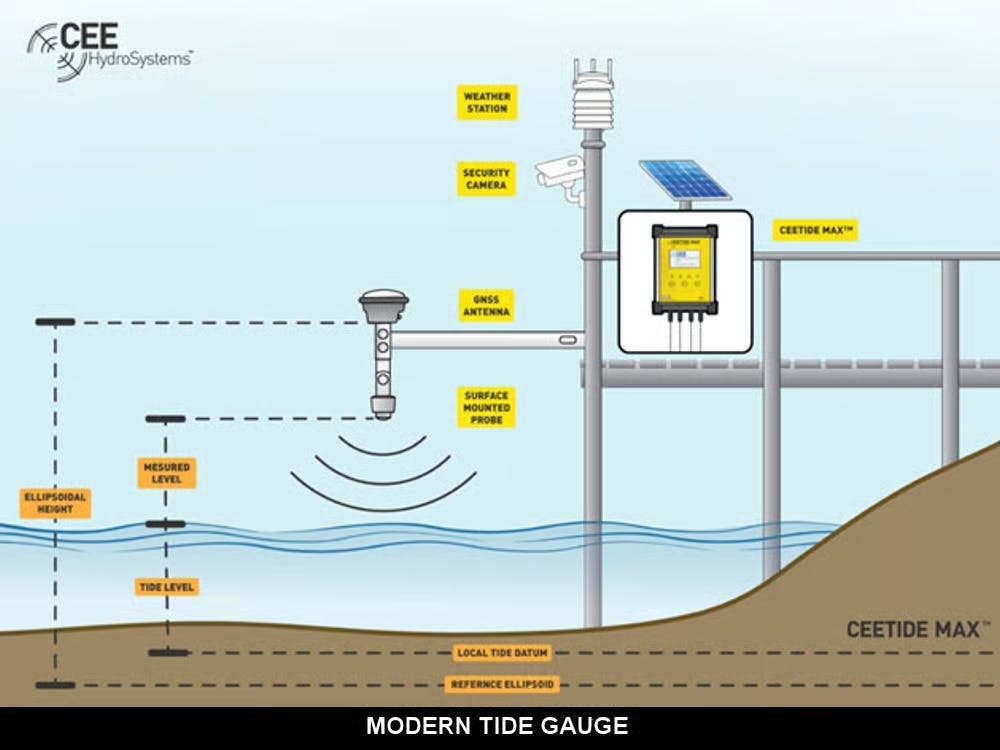
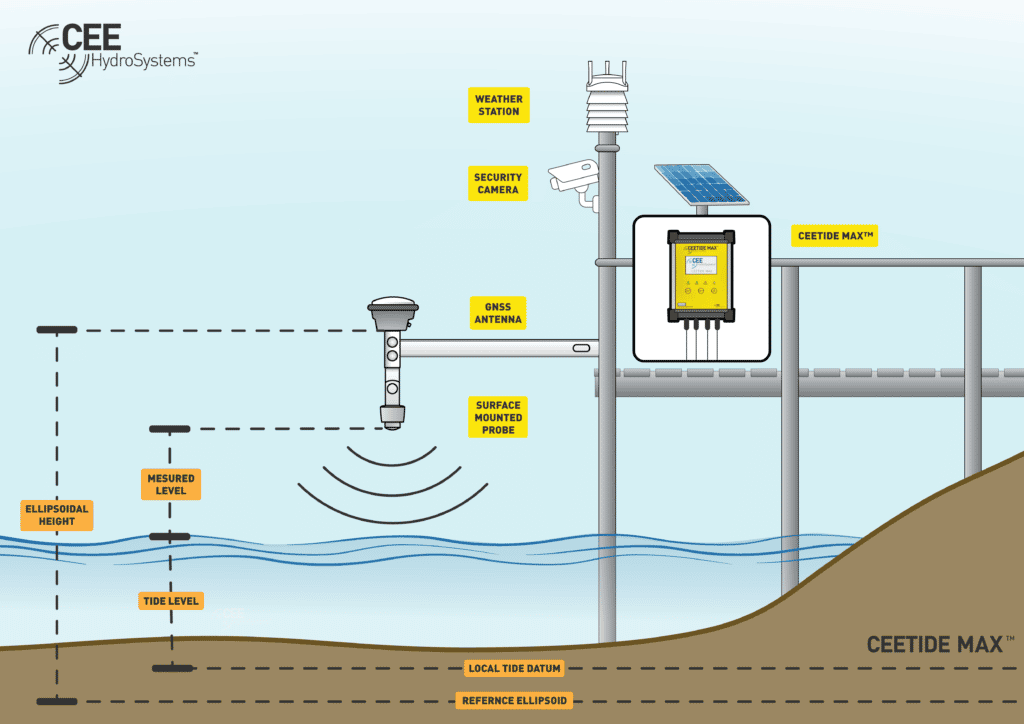
The image below shows a representative modern tide gauge installation.
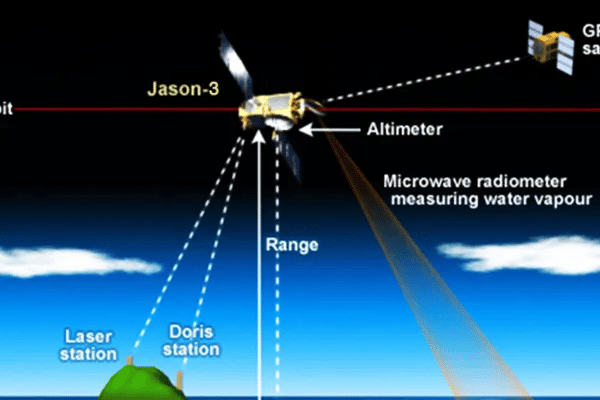
Satellite measurement of sea level began in 1993. It has been conducted by a series of six satellites, two of which continue to function. The Jason-3 orbits at an average orbital altitude of 1,366 kilometers, or 1,366,000,000 millimeters. Signals from the satellite travel to the surface of the water and return to sensors on the satellite, a total travel distance averaging 2,732,000,000 millimeters. NASA reports that the satellites “estimate global mean sea level every 10 days with an uncertainty of 3–4 mm.”, or to one part in 700 – 900 million. Measurement is complicated by the fact that the satellite orbit is elliptical, so the altitude and position of the satellite must be continuously monitored, as indicated in the illustration below.
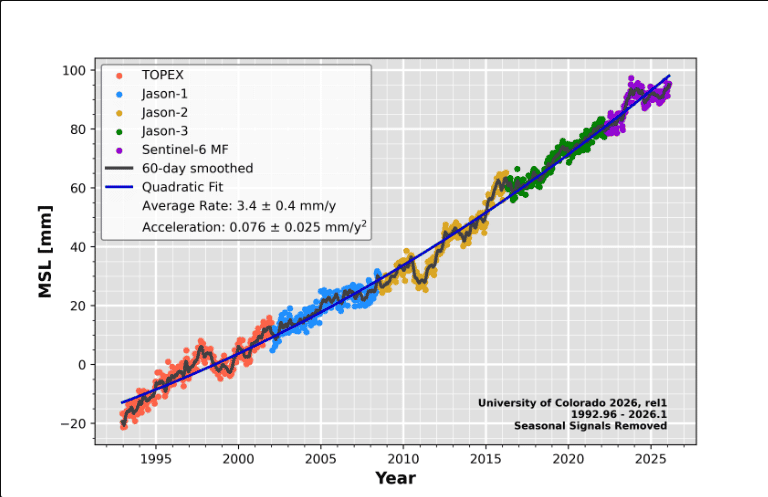
The image below shows the satellite measured rate of sea level rise since 1993, showing measurement histories from 6 separate satellites. The image shows an average rate of sea level rise of 3.4 +/_ 0.4 millimeters per year. Note that the reported average rate of rise is the within the reported range of uncertainty of the estimate and that the reported precision of the estimate is 8.5% of the range of uncertainty of the estimate. More concerning is the reported estimated rate of acceleration of sea level rise, 0.076+/-0.025 millimeters per year per year, which is approximately 2% of the uncertainty of the estimate. Both appear to represent excessive precision.
It is interesting that the consensed climate science community has been reluctant to accept the satellite measurements of global average temperature because they do not support the more rapid warming narrative developed from the near-surface temperature record, but has been very willing to accept the satellite sea level rise measurements because they support the more rapid warming narrative and project acceleration in the rate of sea level rise not apparent in the tide gauge records.
Originally published here.
see rise is 1.44 mm/yr linear and not accelerating. The tide gauges are accurate and reliable. The Jason 5 satellite has a minimum resolution of 25 mm/ measuring a 3.3 mm/yr rise as unreliable data. The Jason 5 has a 1-millimeter minimum resolution. However, it was bench marked with the unreliable Jason 3 data. See ocean data on cctruth.org
Approximately 100 millimeters rise in just over 30 years (or just under 4 inches).
Two things:
1. How much sea level floor rise is occurring from geological activity tectonic plates lifting and from sediment deposition from biological decay and from continuous streams and rivers bringing sediment into the oceans?
2. Several folks have documented historical water marks on coastal areas compared to present day water levels.some are as old as 100 years. Personally, I have documented the sea level of my family’s 80 year old beach-front property. There’s no perceptible change.
Given the narrative of sea level catastrophic rise, why are insurance companies continuing to insure structures and property in these locations and why are local, county and state governmental bodies continuing to allow construction for new structures or remodeling of existing structures?
It sure seems like it has to be about the money (property taxes).