California Dreaming
Solar by Day, Imports by Night

California state government and the climate and environmental communities take great pride in California’s “progress” toward a fossil fuel free clean energy future, as illustrated by the images and text below, recently published on Facebook.
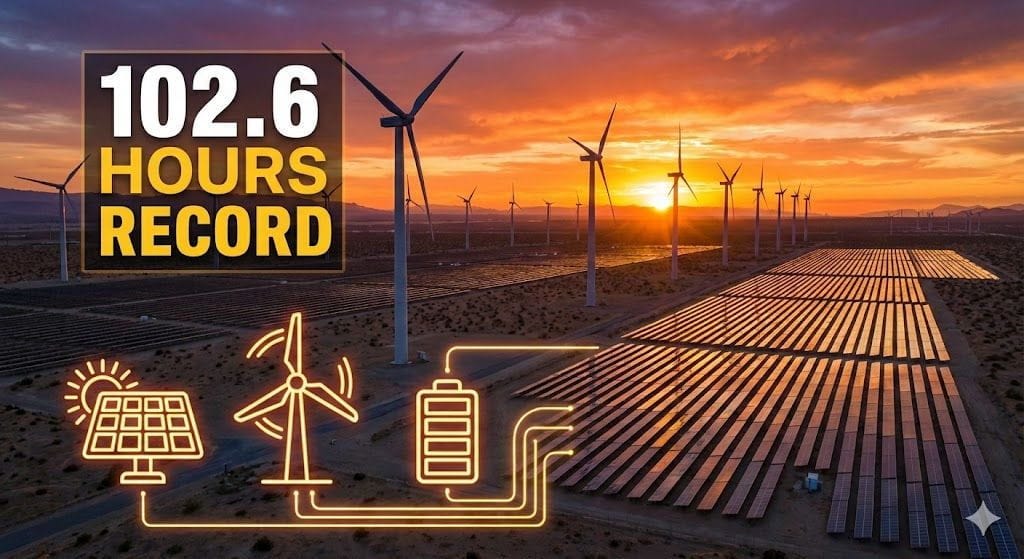
1. California Achieves Record Hours of 100% Clean Energy in Early 2026
In January 2026, California’s main grid ran on 100% clean energy (wind, solar, hydro, and other renewables) for a total of 102.6 hours across 22 days—part of a strong start to the year. This continues the state’s trend where clean sources met or exceeded demand for portions of the day on most days in 2025 (1,856 hours across 77.3 days). These records highlight California’s massive investments in solar, wind, batteries, and grid upgrades, proving reliable 100% clean power is possible and bringing hope for the 2045 goal of zero-carbon electricity!
Hashtags: #CaliforniaCleanEnergy #RenewableRecord #PositiveCaliforni
NOTE: There were 31 days and 744 hours in January, 2026, so 102.6 hours of 100% clean energy is 13% over 71% of the month.
NOTE: There were 365 days and 8760 hours in 2025, so 1856 hours of clean energy exceeding demand is 21% of the year and 77.3 days is not “most of the days in 2025”.
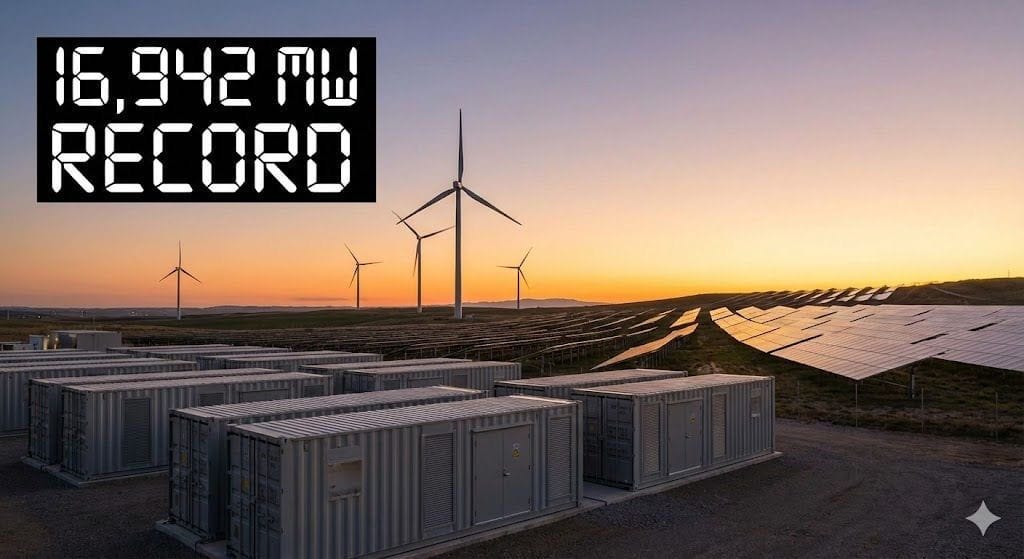
2. California Adds Record Battery Storage Capacity in Late 2025 – Early 2026 Momentum Continues
California reached 16,942 MW of available battery storage by late 2025 (announced at COP30), with additions of ~1,200 MW in just six months—a 2,100% surge since 2019. This record capacity (enough to power ~13 million homes for 4 hours) helped avoid blackouts and enabled more renewable integration. Early 2026 trends show continued growth, positioning California as a global leader in grid reliability and clean energy transition.
Hashtags: #CaliforniaBatteryStorage #CleanEnergyRecord #PositiveCalifornia #GridReliability #UpliftingNews #BatteryBoom
NOTE: California annual electricity consumption is approximately 250 TWH, or 250,000,000 MWH. Four hour storage of 16,942 MW equals 67,768 MWH, or less than 1% of the storage theoretically required to support a reliable 100% renewable grid.
3. California’s Renewable Share Hits New Highs – Solar and Wind Drive Historic Progress
California’s renewable generation (including solar, wind, and other sources) reached 52.3% of the power mix in 2024 (latest full-year data), with non-hydro renewables at 41.3%—the highest annual increase on record. Early 2026 shows continued momentum, with solar and wind output rising and fossil fuel share dropping to record lows (36.3%). This progress, driven by state investments, is reducing emissions and proving clean energy can power the world’s 4th-largest economy reliably.
Hashtags: #CaliforniaRenewables #CleanEnergyHigh #PositiveCalifornia #SolarWindWin #UpliftingNews #GreenProgress
NOTE: California imports approximately 105,000 GWH each year, or approximately 40% of its electricity consumption, of which approximately one third is generated from fossil fuels according to California Energy Commission data.
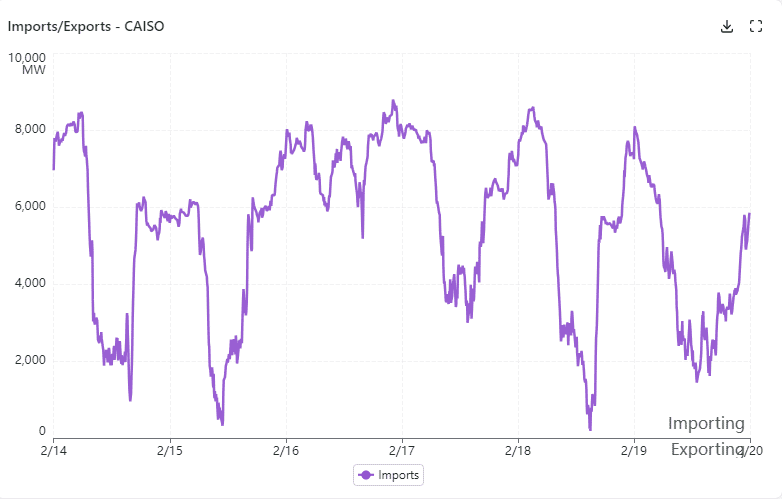
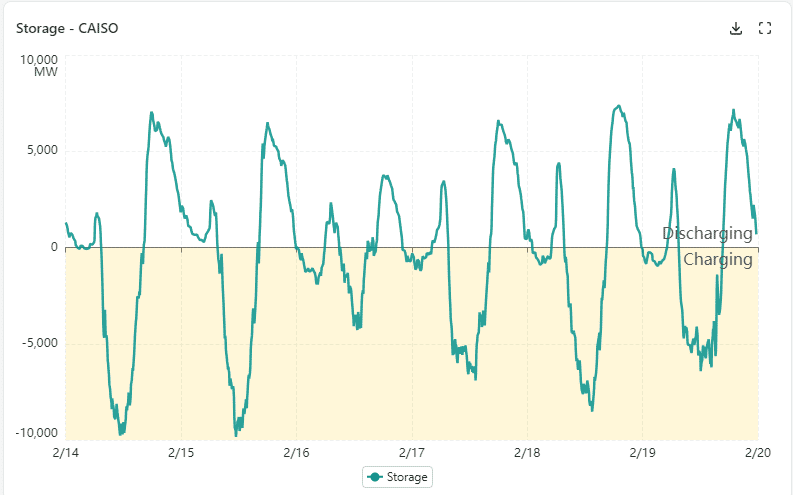
The images below from the Cal ISO Live Dashboard provide interesting insights into the operation of a renewables intensive, capacity constrained grid. Solar generation dominates the generation mix on most days over the period shown, with the exception of 2/16, during daylight hours. Wind generation was available variably but continuously over the period. Storage provided power each day during the evening “duck curve” peak. Large hydro was also increased during the evening “duck curve” peak. Nuclear, geothermal, biomass and biogas generation operated continually throughout the period. Load following generation was provided primarily by natural gas generation and imports. CA ISO does not estimate the contribution of behind-the-meter solar generation, though it totals approximately 20 GW of generating capacity.
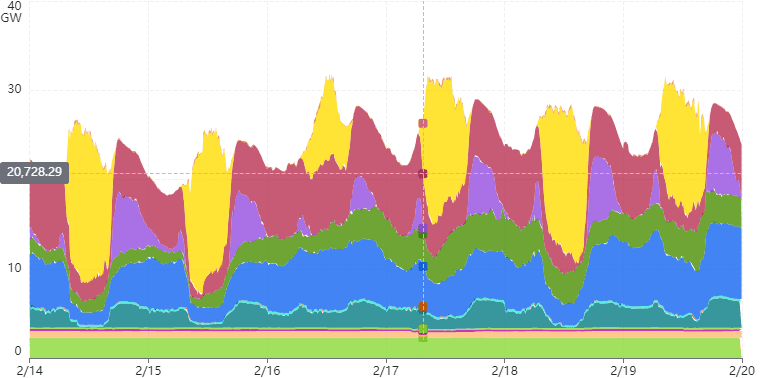

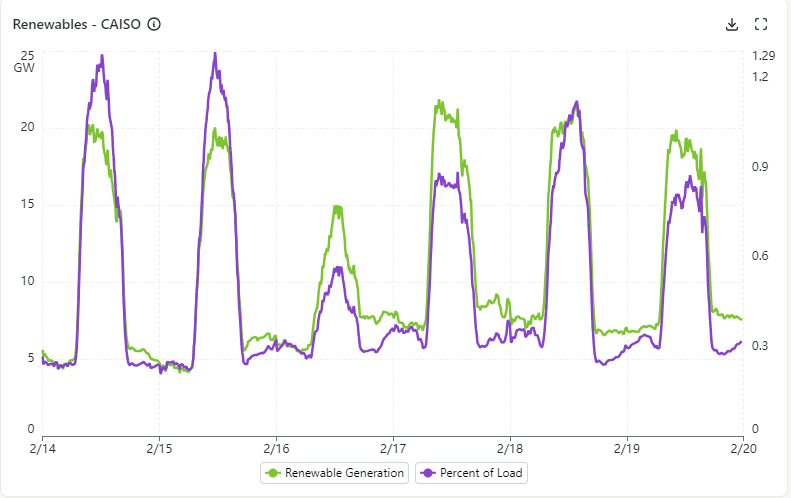
Renewable generation exceeded system load on 2/14, 2/15 and 2/18, reaching a high of 129% of load on 2/14 & 2/15.
CA ISO imported electricity at widely variable rates throughout the period. No power was exported from CA ISO during the period. Imports exceeded 8 GW at peak on 5 of the 6 days, or approximately 25% - 40% of daily peak load.
CA ISO charged and discharged battery storage each day over the period, discharging at rates as high as approximately 8 GW.
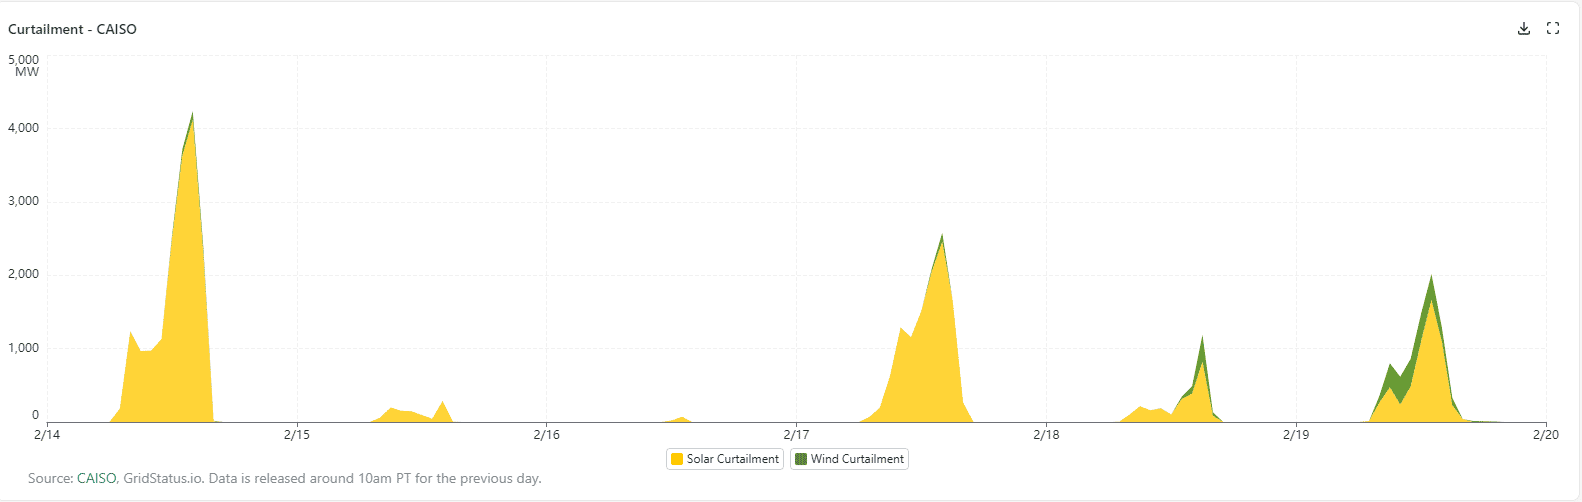
CA ISO curtailed renewable generation, mostly solar, on each day during the period, even while storage was being recharged, as shown below. Curtailments peaked at approximately 4 GW on 2/14.
Curtailment - CAISO
California is clearly a long way from an independent, fossil fuel free grid. It relies heavily on imported electricity, much of which is fossil fueled, and remains woefully deficient in storage capacity and deliverability.
Originally published here.
Thank you for this information debunking this Leftist narrative. Solar, wind, and batteries are parasite power, as a grid always requires generation providing reactive power and synchronous grid inertia. These requirements are set by the laws of physics and engineering. Those two critical attributes are provided by conventional thermal generation and large hydroelectricity.
To obscure this reality, at any time the California grid was supplying "100% solar and wind", the state was also exporting power to adjacent states - and paying those states to take that excess generation. Since solar, wind, and batteries always require conventional generation, this is one of the reasons why California's power rates are typically the highest in the continental U.S.
The political Left demanded that Spain demonstrate a modern industrial society could be powered mostly by sun and breezes. The result was the mid-day April 28, 2025 Iberian Peninsula blackout. At least eleven people who were depending on reliable electric power died. The economic damages stemming from lost productivity and damaged production equipment were measured in the equivalent of billions of U.S. dollars. Those harms have been under-reported since they don't align with the Left's goals. Consider also that the supply chains for all three technologies begin in the People's Republic of China. Thus, there is a mercantilist motivation for this set of policy choices.
Ed, Outstanding article, and I am interviewing Ronald Stein on Monday - it would be fun to have you on a podcast when we can fit you in. I have also had Gene Nelson on, and he was FANTASTIC! With your permision, I would like to run this on the Energy News Beat website where we get about 2 million people a month - hope to get you some new subscribers